Projects · 2011–2012
Road casualties
Between 2000 and 2010, 32,955 people were killed on Britain’s roads and nearly 3 million were injured. In November 2011, ahead of the World Day of Remembrance for Road Traffic Victims, the Guardian Datablog published our interactive map of every one of them. As the Guardian put it, each dot represents a life.
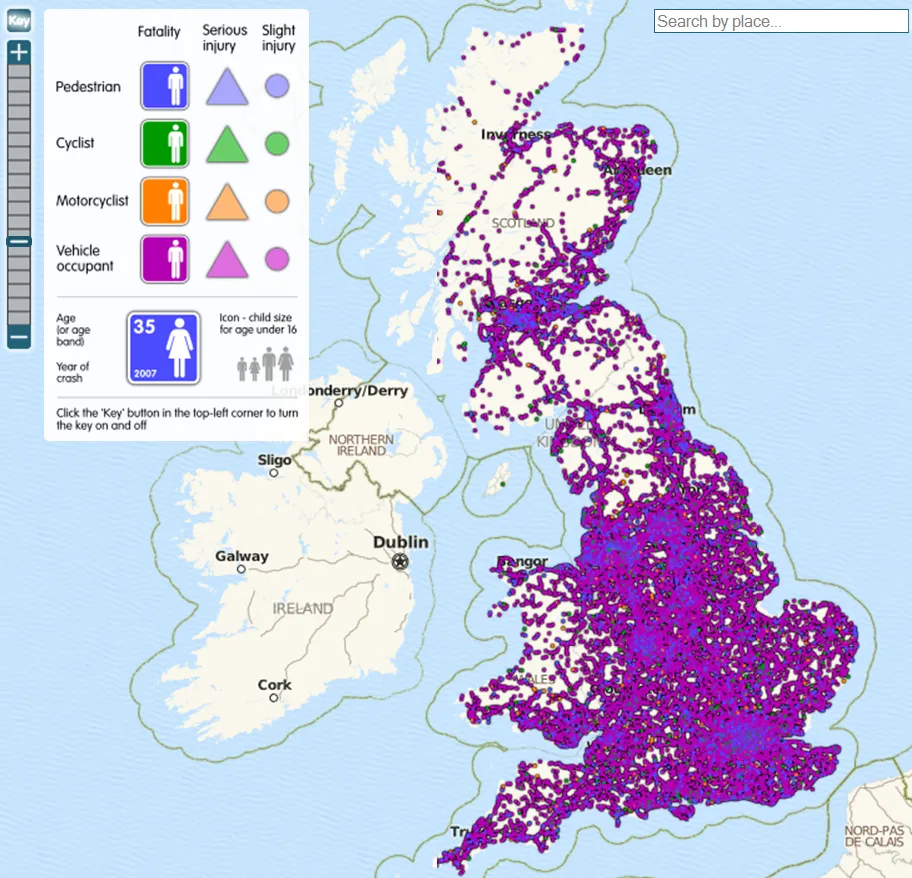
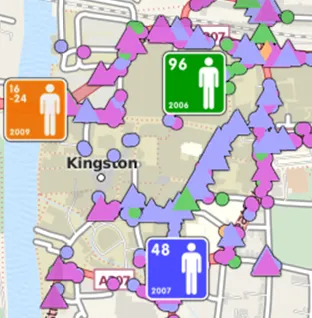
The data came from Stats19, the Department for Transport’s detailed police records of road accidents. Every casualty is drawn at the place it happened. The colour shows who they were: a pedestrian, cyclist, motorcyclist or vehicle occupant. The shape shows how badly they were hurt: a circle for a slight injury, a triangle for a serious one, and a figure for a death. Each fatality symbol also carries the person’s age, sex and the year of the crash, and the figure is drawn child-sized for anyone under 16.
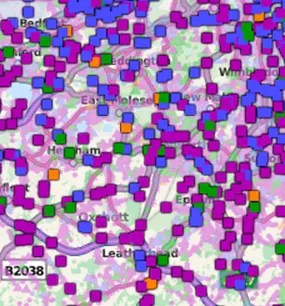
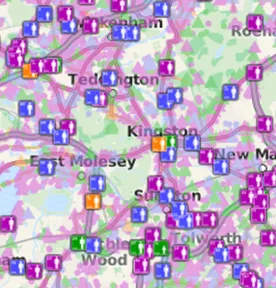
You could search for your town and zoom in. From a distance the symbols merge into the shape of the road network. Closer in they separate, until individual lives can be read street by street.
The USA
A few days later the Guardian published a companion map for the USA. It showed the 369,629 people who died on America’s roads between 2001 and 2009, using data from the National Highway Traffic Safety Administration’s Fatality Analysis Reporting System. It also had its own site, Road Fatalities USA, where anyone could share a view, embed the map, or use screen grabs free of charge in print, on the web or in broadcasts.
London’s cyclists and pedestrians
In April 2012 we made a version for London for the See Me Save Me campaign, which was also published on the Guardian Datablog. It mapped a decade of cyclist and pedestrian deaths and serious injuries from Stats19, and picked out those involving heavy goods vehicles of over 3,500 kg. It came out with transport as a key issue in that year’s mayoral election.
All three maps were drawn over base mapping from MapQuest, built on OpenStreetMap data. The interactive maps are no longer online.