Projects · 2011–2019
Ito Map
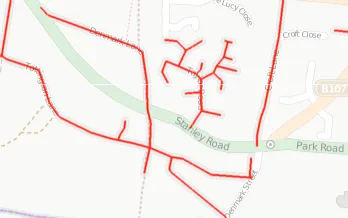
Ito Map was a set of map layers that brought out the “hidden” data in OpenStreetMap. A normal map draws a road, but not its speed limit, whether a building has an address, or whether a railway is electrified. Each Ito Map layer picked one aspect of the data and coloured it by value. That made the information easy to read, and it also made gaps and mistakes stand out, so mappers could see where to work next.
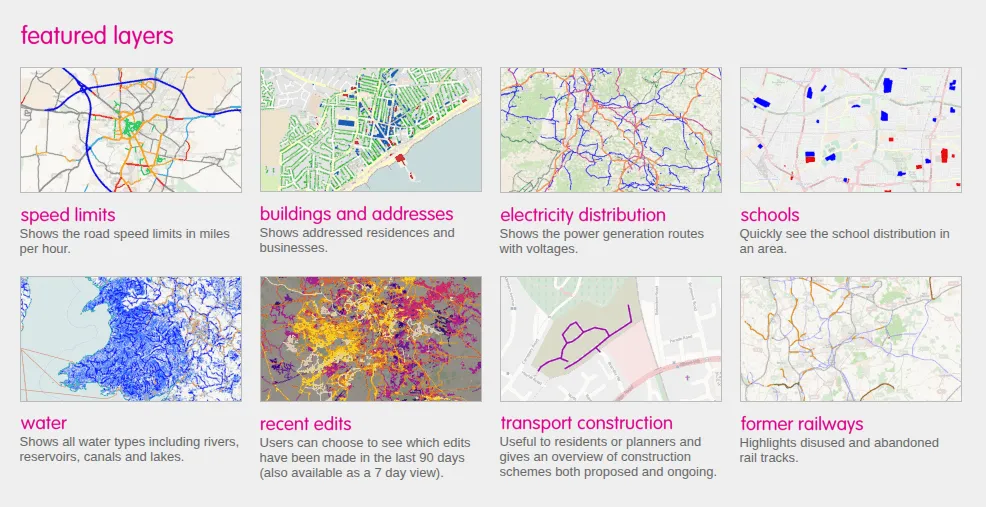
We launched it in March 2011 for the UK and parts of northern Europe. A few days later it covered the USA, Canada and the Caribbean, and by the end of the month the whole world. The data was refreshed every week, and the collection grew to well over a hundred maps.
Seeing what is missing
The colours were chosen so that missing data stood out:
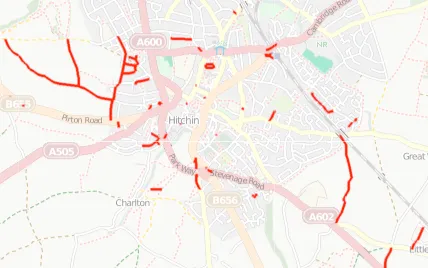
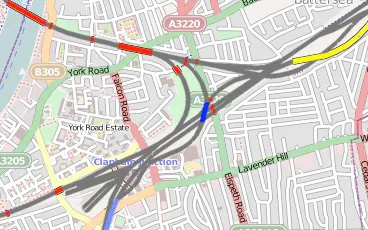
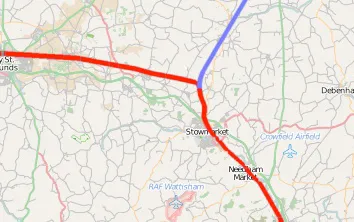
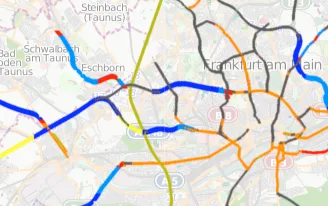
- Speed limits: roads were coloured by their speed limit, in miles or kilometres per hour, with separate maps for all roads and for major roads only. Roads from tertiary upwards with no limit set were drawn in black.
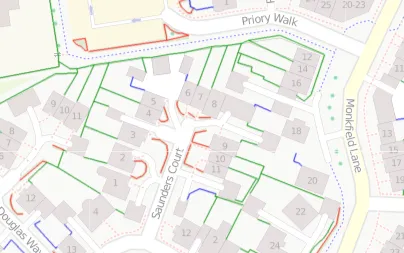
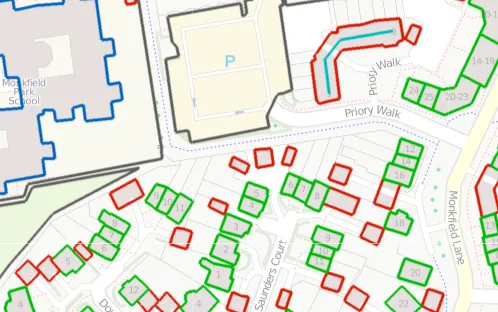
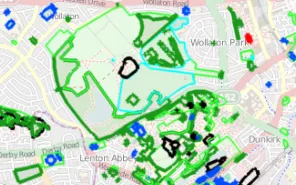
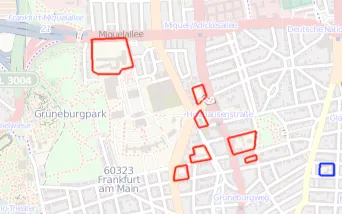
- Buildings and addresses: buildings with a house number were green and those with a house name blue. Buildings with no address at all were red.
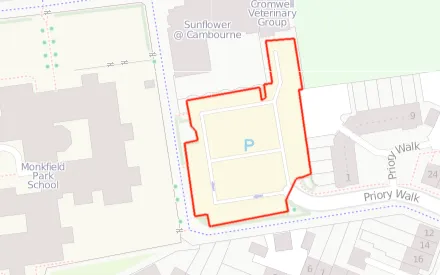
- Schools and car parks: named schools were blue and unnamed ones red. Car parks were blue if their capacity was recorded and red if not.
- Fixme and unknown roads: these layers showed features that mappers had flagged as needing attention, and roads still waiting to be classified.
Railways
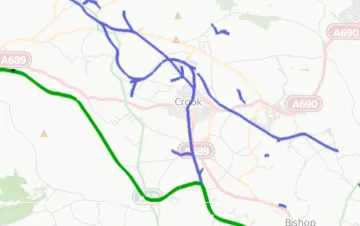
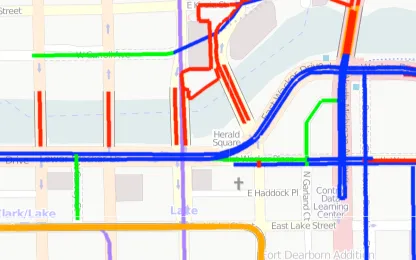
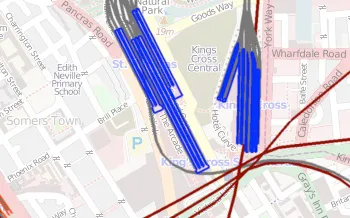
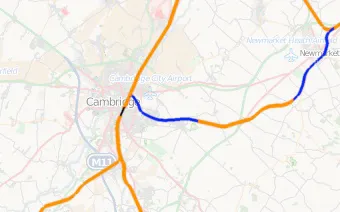
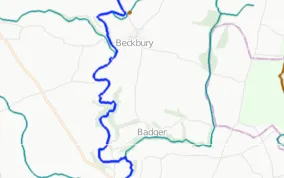
Railways got a particularly detailed set of layers. Separate maps showed electrification, loading gauge, the number of tracks, platforms, and engineering features such as bridges, viaducts, tunnels, embankments and cuttings. The former railways map showed preserved lines in green, disused lines in red, abandoned lines in blue and dismantled lines in light purple, and the metro map picked out underground networks.
The layers
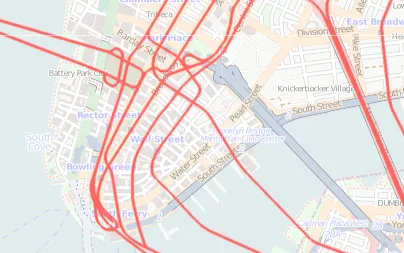
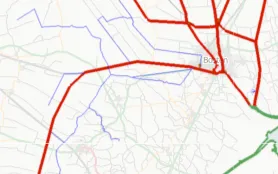
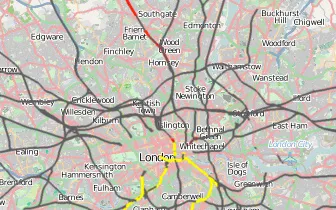
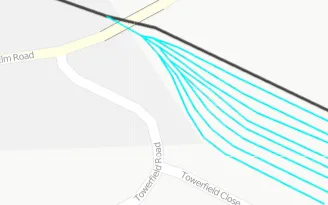
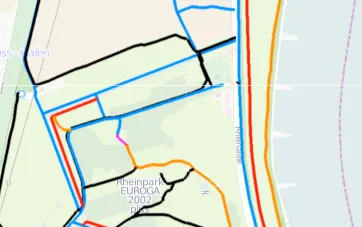
These are some of the layers.
Growing beyond OpenStreetMap
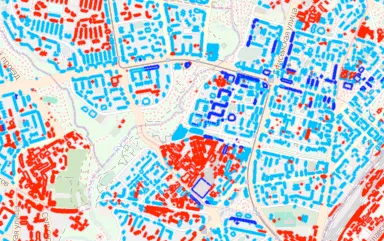
New layers kept arriving, such as building heights in April 2011. From September 2012 you could click on the map to get more information about a feature. Ito Map also grew beyond OpenStreetMap data, adding land use, population and demographics, accessibility and a wide range of other open datasets. Users could create, share and collaborate on maps built from these layers.
Ito Map was developed with support from Ideas in Transit. It closed in July 2019, when Ito World withdrew its OpenStreetMap tools.