


These are some notes about a useful DSO shadeop for determining what PRMan is doing with memory allocation. It was developed specifically to analyse a problem with excessive memory consumption of DynamicLoad procedurals. The platform used was Linux IA32 - although the concepts should transfer to other platforms.
The simplest way to look at the memory usage of a render is to watch the output
from top, keeping an eye on the RSS (resident set size) of prman.
There are two problems with this: first, RSS is not as tightly connected to
allocated memory as you would like, and second, there is no correlation between
the values and the part of the image being rendered.
I wanted to be able to visualise the exact memory consumption over the image. The malloc library has a statistics function mallinfo that will return the amount of memory that malloc has allocated including a small amount of housekeeping data. The idea was to place a semi-transparent surface just in front of the camera shaded with these statistics. Clearly this extra geometry will have an effect on the memory used, but this can be ignored since we are interested in patterns not absolute values.
Return a float containing the number of megabytes allocated. The mallinfo structure contains two byte totals that need to be summed (for more details see /usr/include/malloc.h).
#include "shadeop.h"
#include <malloc.h>
SHADEOP_TABLE(hal_memory_allocated) =
{
{ "float hal_memory_allocated ()", "", "" },
{ "" }
};
SHADEOP(hal_memory_allocated)
{
struct mallinfo mi=mallinfo();
((float *)argv[0])[0]=(mi.hblkhd+mi.uordblks)/1024.0F/1024.0F;
return(0);
}
Compile with:
cc -I${RMANTREE}/include -c hal_memory_allocated.c
ld -shared hal_memory_allocated.o -o hal_shadeops.so
This is a very simple shader which just converts the memory consumption to a red-to-green scale with 200M being the default upper scale. This could be easily extended to colour spectrums etc.
surface memory_debug(float maximum = 200)
{
uniform float m = hal_memory_allocated() / maximum;
Ci = color(1-m, m, 0);
Oi = color(1, 1, 0);
}
Obviously, it is important to be at least partially transparent so that the geometry that you are testing is actually rendered through the surface, and you can see how it lines up with the statistics.
|
PRMan 11.1 |
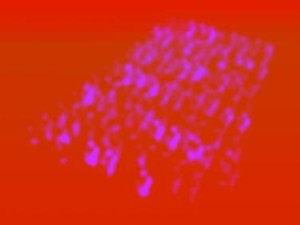
PRMan 11.3 |
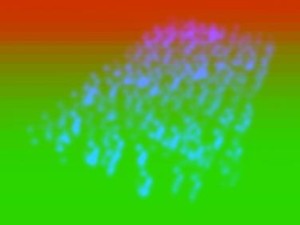
The following image is the result of a scene of procedural people rendered with PRMan 11.1 (sorry, the original images are part of a production, so I had to blur them).
Here the memory seems to constantly increase - none of the data associated with each procedural is being freed until the end of the frame. This shows graphically the problem I was trying to track down. When I tried again with the latest PRMan 11.3 release, the results changed.
Here the memory consumption is much lower and does not accumulate. It also appears to be proportional to the amount of geometry at each bucket scan line. Clearly there was a memory freeing problem that has been fixed in the latest release. Anyone planning to use procedural geometry should be sure to use 11.3 or later.